
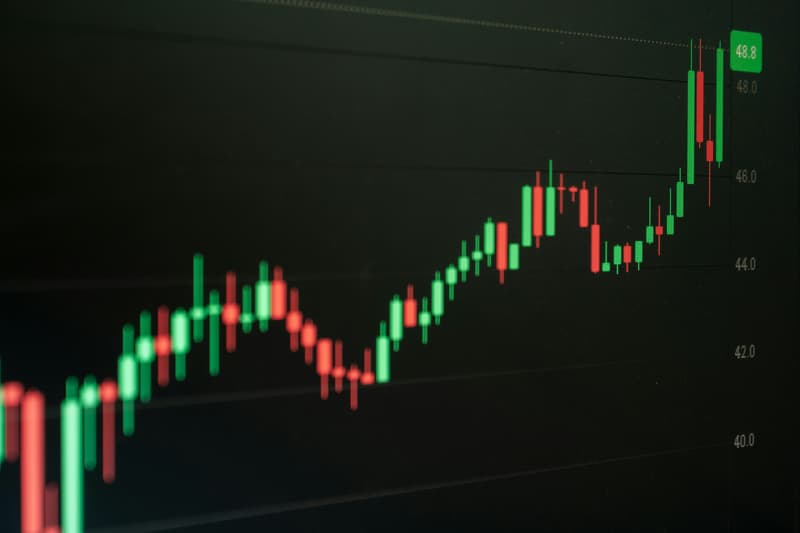
Pull five years of GIFT Nifty history and something odd appears. The data changes character partway through.
That is not an error in your download. Before 3 July 2023, this contract was SGX Nifty, trading in Singapore.
On that date, trading moved to NSE International Exchange in GIFT City through the GIFT Connect arrangement described by SGX. Sessions were restructured around India's time zone at the same time.
So a long history is really two histories joined together. At Belong, this is the first thing we tell anyone analysing past moves.
The background is covered in GIFT Nifty versus SGX Nifty.
What historical data actually contains
Open interest means the number of contracts still open at the end of a period. Rising open interest alongside a move suggests new positions, not just traders closing old ones.
Settlement prices come from the exchange's own method, not simply the last trade of the day. For official analysis, they are the more reliable reference.
Continuous charts and the roll jump
Futures contracts expire monthly. A long history stitches successive contracts into one continuous line.
Each switch from an expiring contract to the next can create a jump. The new contract carries a different premium to the index, so its price starts at a different level.
Some data providers adjust past prices to remove these jumps. Others leave them in. The two series tell different stories about the same period.
Check which method your source uses before measuring any move that crosses a month end. An unadjusted roll can look like a sharp rally that never happened.
👉 Tip: If a large move sits exactly on an expiry date, suspect the roll before you suspect the market.
Measuring an opening gap properly
Most people use this data to study how well GIFT Nifty anticipated the Nifty open. It is easy to do badly.
A careful measurement has four steps.
Take GIFT Nifty at the same fixed time before NSE opens, every day
Compare it with the Nifty 50's actual opening level, not the previous close
Adjust for the futures premium, which varies with time to expiry
Separate expiry weeks, since the premium behaves differently near expiry
Skip the premium adjustment and your study will conclude that GIFT Nifty systematically overestimates the open. That conclusion reflects the premium, not the indicator.
The Nifty 50's own daily history is published by NSE. Use the official open, not a delayed quote.
Timestamps and time zones
Intraday data carries timestamps, and not every source uses Indian time. Some use exchange time, some use UTC, some use your local zone.
A one-and-a-half hour offset turns a pre-open reading into a mid-session one. Your conclusions shift with it, and nothing on the chart warns you.
Confirm the time zone of every file before merging two sources. It is tedious, and skipping it corrupts everything downstream.
Market holidays add another mismatch. GIFT City and NSE calendars do not always align, so some days exist in one series and not the other.
Be sceptical of gap-fill statistics
You will find confident claims that most opening gaps close within the day. Treat them carefully.
Results depend heavily on how a gap is defined, which period is studied and whether roll jumps were removed. Change any of those and the percentage moves.
Many published figures come from short periods that happened to suit the claim. Few mention the SGX-to-GIFT break at all.
If a statistic matters to a decision, reproduce it yourself on clean data. If you cannot, give it little weight.
Base rates, sample size and regimes
A pattern seen across a few dozen days is not a pattern. It may simply be what those days happened to do.
Markets also change character. A calm year and a volatile year produce very different gap behaviour, and averaging them hides both.
Compare like with like. Split the data by volatility conditions before drawing a single conclusion.
Averages hide spread in the same way fund category averages do. See category average versus top fund.
The problem with memory
People remember the dramatic gaps and forget the dull days. That skews any intuition built from watching the market.
The morning GIFT Nifty called a huge fall correctly stays in memory for years. The dozens of quiet mornings leave no trace.
Historical data is valuable precisely because it corrects memory. Use it for that, not to confirm what you already believe.
What history is genuinely useful for
Three things, in our experience.
It shows the typical size of an overnight move, which helps you judge whether today's is unusual.
It shows the typical premium on quiet days, which lets you strip premium from today's reading.
It shows how thin sessions behave, which tells you how much to trust a late-night move. That is a question of liquidity.
What it cannot do
History describes. It does not forecast.
A pattern that held for years can stop the day enough people trade on it. Past data in every market carries that warning, and futures are no exception.
The same caution applies to funds. See how to choose a mutual fund using past performance correctly and past returns versus consistency.
Our daily archive
We keep a daily record of GIFT Nifty movements on the blog. Each page captures how that day unfolded.
Examples include the June 8, 2026 page and the July 15, 2026 page. They are useful for checking what happened around a specific event.
For live data, use our GIFT Nifty tracker.
For long-term investors
Opening gaps are a trader's question. A long-term investor needs a different lens on history.
Point-to-point returns depend heavily on the start and end dates chosen. Rolling returns show how an investment behaved across many start dates. See rolling returns versus point-to-point returns.
Adjust for inflation as well. The difference between the two is explained in nominal versus real return.
Valuation history helps too. The trailing P/E ratio looks back at past earnings, which is its strength and its limit.
A note on why this appeals
Historical data feels like an edge. With enough rows, surely the pattern will appear.
Usually it does appear, whether it exists or not. Large datasets reward patient searching with convincing coincidences.
The discipline is deciding what you are testing before you look. Everything else is storytelling with numbers.
If you are moving back to India
Once resident, you will watch the domestic open directly and pre-market history matters less day to day.
Your access to trade the contract may change, since resident access is contested. The historical data itself stays available to study.
If you live in India
Indian investors can study the same public data. Trading GIFT Nifty is a separate question with contested resident access.
For global investing from India, fund performance history matters more than futures gaps. See how to evaluate GIFT City fund performance correctly. Remittance rules sit with the Reserve Bank of India.
Mistakes we see
The series break sits under all the others. Any long study that ignores it starts from a flawed foundation.
Decision clarity
If you study opening gaps, fix the time, adjust for premium and separate expiry weeks.
If your data crosses July 2023, analyse the two periods separately first.
If a statistic will shape a decision, reproduce it on clean data before using it.
If you invest for the long term, look at rolling returns, not daily gaps.
Where to go from here
If you plan to trade the contract, read our futures and options page. The venue is overseen by the International Financial Services Centres Authority.
For investments judged on years rather than mornings, our GIFT City mutual funds tool lists dollar options. Evaluating them is covered in evaluating USD mutual funds.
Examples include the DSP Global Equity Fund and the Tata India Dynamic Equity Fund.
For regional and mid-cap exposure, see the Edelweiss Greater China Equity Fund and the Sundaram India Mid Cap Fund.
Start through our mutual funds product page. Larger allocations use the GIFT City AIF tool.
Primary market access sits in our GIFT City IPO guide and the IPO product page.
For returns that do not need historical analysis, compare USD fixed deposits on our NRI FD rates tool. Our tax filing service handles the Indian reporting side.
Review what you own on a schedule, not on a whim. See the mutual fund review framework, performance tracking and what benchmarks to use for GIFT City investments.
For the wider habit, see tracking your finances, things to review in USD investments and funds with consistent returns.
Frequently Asked Questions
When did SGX Nifty become GIFT Nifty?
On 3 July 2023, when trading moved to NSE International Exchange in GIFT City. Data before and after that date should be analysed separately.
Why does historical GIFT Nifty data show sudden jumps?
Usually because a continuous chart switched to the next contract month. Check the roll method your data source uses.
How do I measure how well GIFT Nifty predicts the open?
Take GIFT Nifty at a fixed time each day, compare with Nifty's actual open, and adjust for the futures premium.
Do most opening gaps fill during the day?
Published claims vary widely depending on definitions and periods studied. Reproduce any figure on clean data before relying on it.
Is past GIFT Nifty data useful for long-term investors?
Not much. Long-term investors are better served by rolling returns and inflation-adjusted performance.
Sources
NSE International Exchange: https://www.nseix.com/
Singapore Exchange, GIFT Connect: https://www.sgx.com/derivatives/products/gift-connect
National Stock Exchange of India: https://www.nseindia.com/
International Financial Services Centres Authority: https://www.ifsca.gov.in/
Reserve Bank of India: https://www.rbi.org.in/
Disclaimer
This article is for education only. It is not investment advice or a forecast.
Past market behaviour does not predict future results. Data methods vary between providers, so verify how your source constructs its series.
Please consult a registered adviser before trading on any historical analysis.